Dogs of the Dow Weekly
This board is no longer published. It ran Sundays at 10:07 AM ET and last posted September 6, 2026. This page stays up because old posts on X link back to it; everything below still describes how to read one if you are looking at one now.
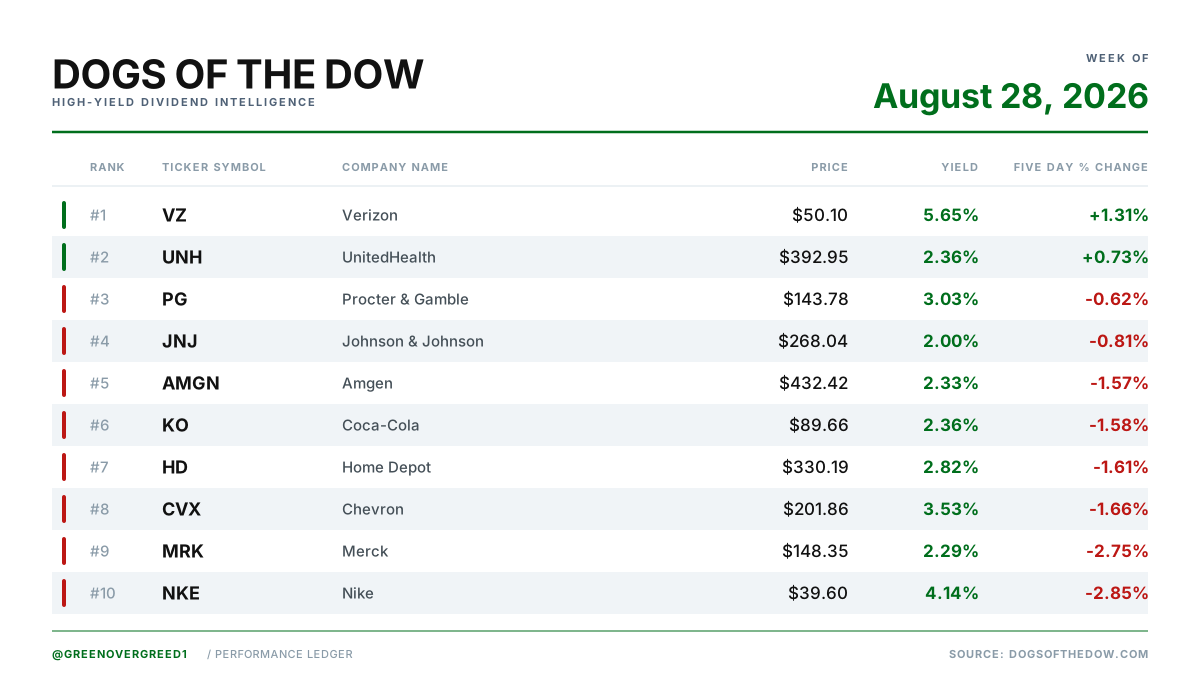
The ten Dogs of the Dow ranked by percent change, with the measurement period named on the asset.
What the Dogs of the Dow are
A long-running income strategy: at the start of each year, take the ten Dow Jones Industrial Average components with the highest dividend yield and hold them for the year. The premise is that a high yield on a large, established company often reflects a depressed price rather than a broken business. The ten names are fixed for the year, which is what makes a weekly tracker of them meaningful.
What is in the post
An image carries the same ten as a ranked board, and a written reply follows.
The one thing to check on this asset
The performance column can be measuring one of two different things, and the header always says which. FIVE DAY % CHANGE means it is measuring the week. YTD % CHANGE means it is measuring from the start of the year.
Most weeks it is the five-day change. On a week where a clean five-day comparison cannot be made, the column shows year to date instead and the header changes with it. The header and the numbers underneath it always describe the same period, so the header is the thing to trust, and a plus 30% in a year-to-date column is not a week.
Why an OTC account tracks the Dogs
Contrast. The Dogs are the opposite end of the risk spectrum from a trip-zero OTC name: large, liquid, dividend-paying, decades old. Watching both in the same feed is a weekly reminder that a percent is not a percent, and that a 2% week in a Dow component and a 200% week in a sub-penny name are not the same kind of number.
What it does not mean
- It is not a recommendation of the strategy or of any name in it.
- The ten names are fixed for the calendar year. Rank movement within the ten is the only thing changing week to week.
- Weekly rank is noise at this scale. The Dogs are a year-long idea. A one-week ranking of them is a scoreboard, not a signal.