What gets published, and when.
Thirteen recurring assets, 41 posts a week, every one built from primary market data and published on a fixed schedule. No calls, no alerts, no picks. These are recaps of what already happened, built the same way every time so that one week can be compared to the next.
- 9:00 AMOTC Price Bands
- 9:15 AMPre-Market Movers
- 4:37 PMTop 20 by Dollar Volume
- 5:00 PMTop 20 Shares Traded Volume
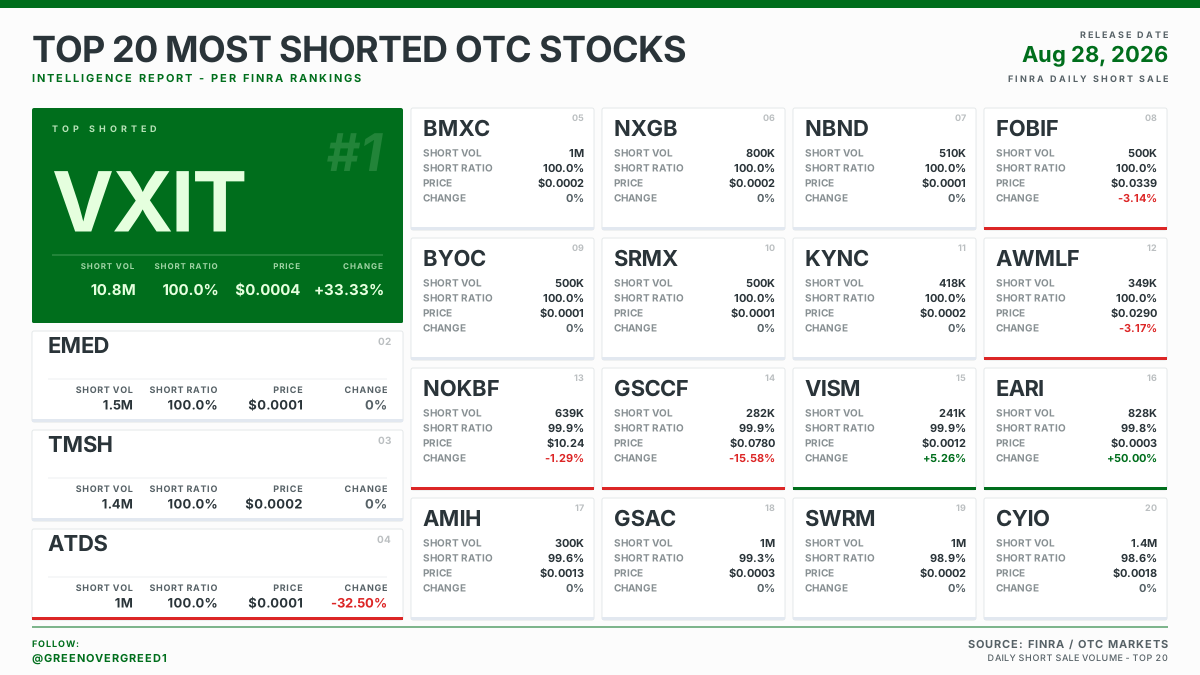
- 5:25 PMTop 20 Most Shorted
- 8:10 PMAfter-Hours Movers
- 10:00 PMTop 5 Insider Buys
- 9:20 AMWeekly Volume Leaders
- 12:40 PMVolume Calendar
- 2:50 PMOTC Last 5 Sessions
- 9:50 AMWeekly Dollar Volume Leaders
- 12:40 PMDollar Calendar
- 5:50 PMWeekly Most Shorted
One week on one grid.
Each publication is one row, listed once. A lit square means it runs that day. Five across is a daily post; one square is a weekend wrap. Every time is US Eastern. Tap a row for its guide.
Three things worth knowing before you read any of it
Volume is not direction.
Almost every board on this calendar ranks names by how much trading happened, not by how well they did. A name can lead a board on a 40% loss, and frequently does. Colour on the assets carries direction. Position carries size.
Dollars and shares disagree, and the disagreement is the point.
In a market where one name trades at $0.0001 and another at $0.09, share counts are not comparable across names. That is why the same session is published once by shares and once by money, and why the two boards rarely hold the same twenty names.
Short volume is not short interest.
This is the single most misread number on the account, so it gets its own page. Read Top 20 Most Shorted before drawing a conclusion from one.
The field guide
Every publication on the calendar has its own page: what is on the asset, where the numbers come from, how it is built, and, just as importantly, what the numbers do not mean. Each page carries the real published board rather than a mockup, so every figure in the text can be checked against the image above it.
It is written to be the reference you send someone instead of explaining it again.
Open the field guide