Calendar › Field guide › OTC Last 5 Sessions
Field guide
OTC Last 5 Sessions
Saturdays 2:50 PM ETSource: OTC MarketsImage plus a three-paragraph post
The one-line version
A written recap of the past five OTC trading sessions, structured as topline, interpretation and takeaway.
What is in the post
Three paragraphs, separated by blank lines, each doing a specific job.
| Paragraph | Job |
|---|---|
| Topline | The facts of the week, kept short enough to sit above X's Show more fold. Dollar volume, direction, the sessions that stood out. |
| Interpretation | What the shape of the week means. Where the money concentrated, how breadth moved, what changed against the prior week. |
| Takeaway | The one thing worth carrying forward. |
The three-part shape exists because of how X displays long posts. Everything a reader sees without tapping is the first paragraph, so the first paragraph has to survive alone.
Where the numbers come from
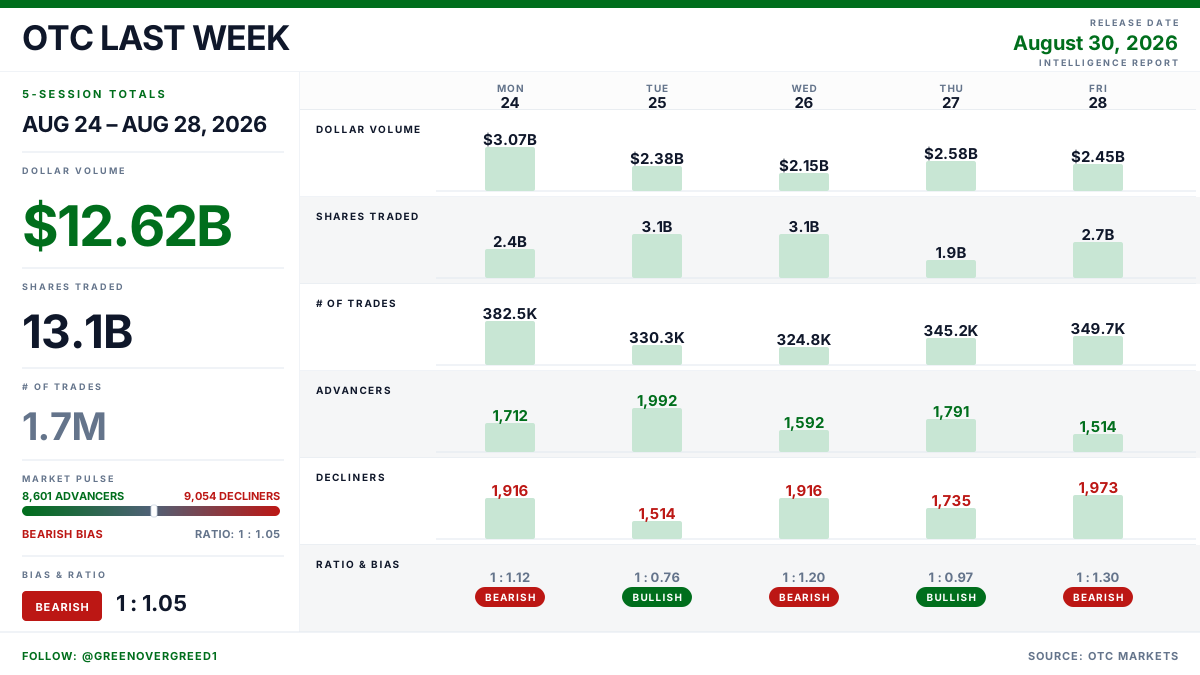
The same OTC Markets session data behind the week's daily boards, so the recap and the boards cannot disagree. A market holiday inside the window simply means fewer sessions, and the recap covers what actually traded.
Every figure in the paragraphs comes from that session data. The prose is written around the numbers, never the other way round.
How to read it
- The topline is descriptive. It is the week's dollar volume, its direction and its outliers.
- The interpretation paragraph is the only place on this calendar that argues. It draws a conclusion from the week's shape. Treat it as a reading, not as a fact.
- The takeaway is not a forecast. It is what the week established, not what next week will do.
What it does not mean
- No predictions. Nothing in the three paragraphs is a claim about the coming week.
- No individual recommendations. Names appear because they carried the week's dollars, not because they are being suggested.
- Five sessions is a short window. A single very large day can dominate the whole recap, and when it does the recap says so.