Volume Calendar
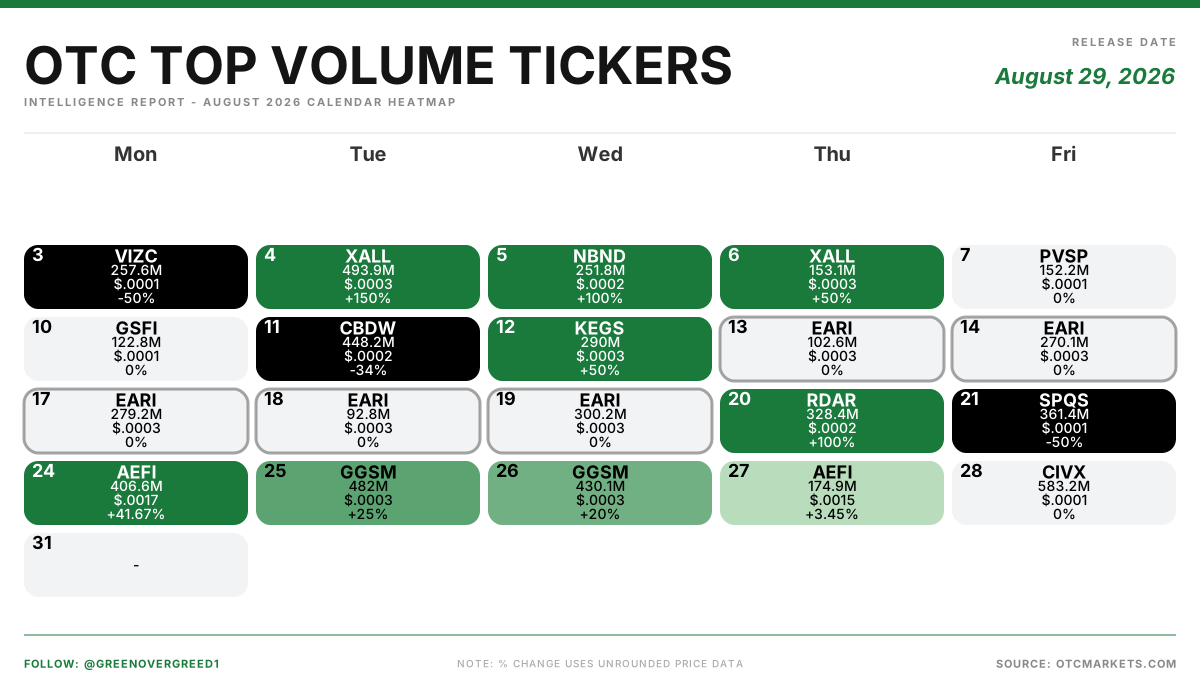
A month-to-date calendar showing which OTC name led share volume on each individual trading day.
What it is for
A daily board tells you who led one session. It cannot tell you whether that was the fourth time this month or the first. The calendar puts the month on one grid so rotation becomes visible: how many different names have taken the top spot, which ones keep coming back, and whether the month has been one name's month or twenty names'.
What is on the image
- A calendar grid for the current month, weekends and non-trading days left empty.
- In each trading day cell, the ticker that led share volume that session, with its volume and its percent change for the day.
- The month's highest-volume single day and its lowest, each named with the date.
- The names that appear more than once, and how often.
What is in the post
An opening sentence, then the repeats line, the highest-volume day and the lowest-volume day. The opening sentence changes each week and says only what the month's own figures support.
One unique leader across many sessions describes a month one name owned. Fifteen unique leaders across seventeen sessions describes a month where the top spot changed hands almost daily. Those are genuinely different markets and the sentence says which one it was.
Where the numbers come from
The same OTC Markets session data behind the daily volume board, one month of it.
How to read the repeats
The repeats line is the most useful thing on the asset. A ticker that has led share volume on six separate days this month has held attention across the month, not just spiked once. That is a different fact from any single day's board and it is not visible anywhere else on the calendar.
What it does not mean
- Leading a day is not performing well. The percent change in the cell is often red.
- It is share volume, not dollars. The Sunday Dollar Calendar is the same grid built on money moved, and the two frequently name different tickers on the same day.
- It is month to date. Early in a month the grid is mostly empty and the unique-leader count means very little.