Weekly Most Shorted
The twenty OTC names with the highest true weekly short percentage across the full week.
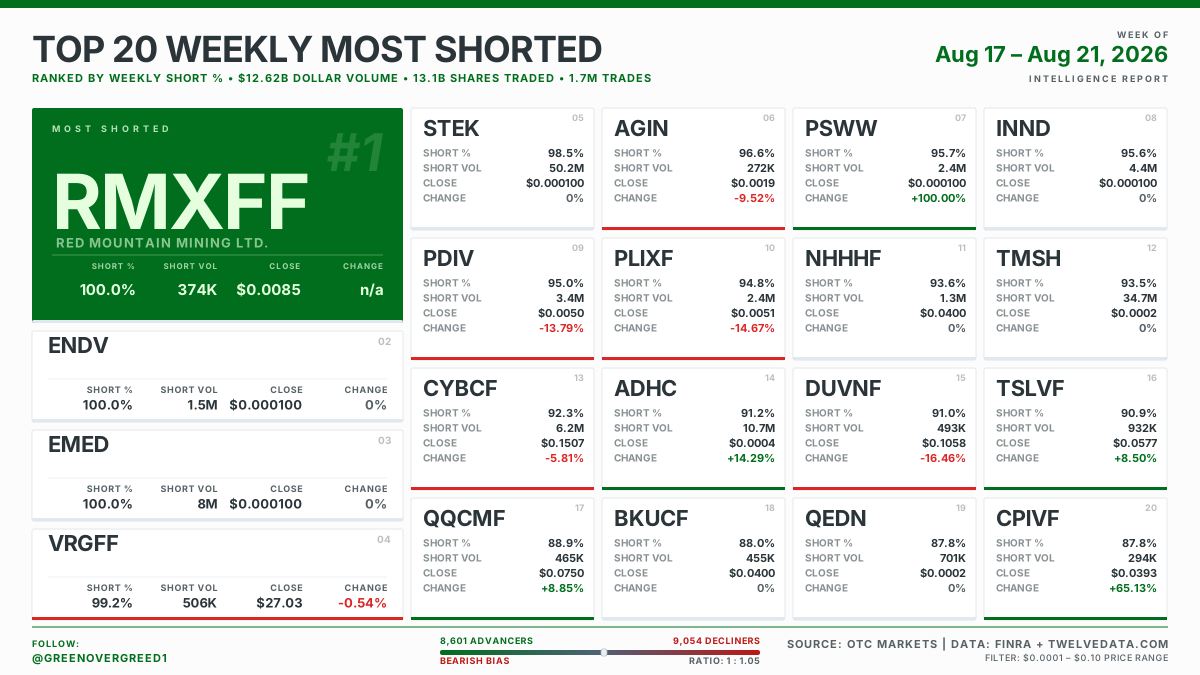
Short volume is not short interest. This measures what fraction of the week's reported volume printed as short sales. It does not measure how much of a company's stock is held short. Read the daily Top 20 Most Shorted page for the full explanation of why the two are different, because everything there applies here.
Why the weekly figure is better than the daily one
A single day's short percentage is volatile. One large block, one quiet afternoon, one market maker working an order, and the ratio moves several points. Aggregating the whole week and dividing once removes most of that.
The critical detail is that the weekly number is a true weekly percentage, not an average of the five daily ones. A quiet Monday does not count as much as a heavy Thursday; each session carries the weight its own volume earned. That is what the caption means by true weekly short percentage, and it is why this number and the five daily ones will not reconcile by averaging.
A week also has to be a week. A name that reported one session is not carrying a weekly figure at all, however high its ratio, so two reported sessions is the floor for the board. It matters more than it sounds: a single day at 100% will outrank a name shorted heavily for five days, and until this rule existed it did.
Where the numbers come from
FINRA's Reg SHO daily short sale volume files across the whole week, which are public, plus an independent market-data provider for the weekly close.
The ranking comes from FINRA alone. The price is a detail on the card rather than part of the order, which is why a name whose weekly price cannot be established still belongs on this board and shows n/a instead of dropping off it. A quoted price that disagrees by an order of magnitude with what the stock actually printed that week loses to the tape.
What the colour means here
On the weekly volume and dollar boards, green means the week went well for the name. On this board, green means the shorts got squeezed and red means they won. Same colours, opposite subject, because the board is about the short side.
What is in the post
A fixed caption stating the selection rule and what the colours mean on this board, the week range naming the trading days covered, then the twenty symbols in board order. Only rank one carries a cashtag.
What it does not mean
- It does not mean the float is shorted. That is short interest, published twice a month, and it is not on this board.
- It does not mean a squeeze happened or is coming. Green means the price rose over the week, which is not the same as a covering event.
- It is not a scan of the whole market. Like the daily board, it covers the week's genuinely shorted names rather than every OTC symbol.
- Days reported varies. Two reported sessions is the floor, not the norm, and the count is not printed on the card. A percentage near the top of this board can rest on two sessions or on five, and the image will not tell you which.
- A blank is not a flat week. Where the week's price cannot be established the card shows n/a rather than a zero, because the name earned its place on figures that do not depend on a quote.