Dollar Calendar
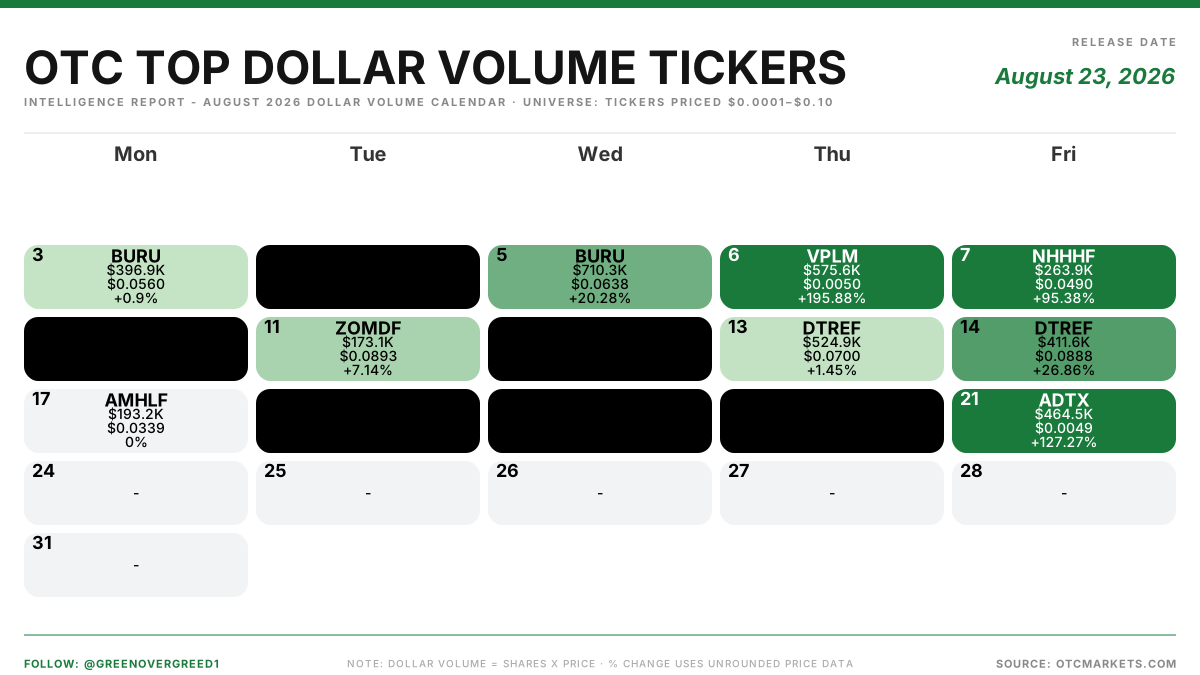
A month-to-date calendar showing which OTC name moved the most money on each individual trading day.
What it is for
The same grid as the Saturday Volume Calendar, built on money instead of shares. It answers whether the month has had one name absorbing the OTC market's dollars or a rotating cast.
What is on the image
- A calendar grid for the current month, with each trading day carrying the ticker that led dollar volume that session, plus its dollars, its price and its percent change.
- The month's biggest dollar day and its smallest, each named with the date.
- The tickers that led more than once, and how often.
Where the numbers come from
The same OTC Markets session data behind the daily dollar-volume board, one month of it, under the same $0.0001 to $0.10 price filter.
Reading it against the Saturday calendar
Put the two grids side by side for the same month. Days where the two calendars name the same ticker are days where one name genuinely dominated the session on both measures. Days where they differ are days where the certificates and the money went to different places, which in this price range is the normal case rather than the exception.
A month where the dollar calendar has three unique leaders and the volume calendar has fifteen describes a market where money concentrated hard while share turnover stayed spread out.
What it does not mean
- Leading a day is not a good day. The percent change in a cell is often negative.
- It is month to date. The unique-leader count is not meaningful in the first week of a month.
- It is drawn from the sub-dime dollar board. The same $0.0001 to $0.10 price filter applies, so this is the penny market's money, not all of OTC's.