Top 20 Shares Traded Volume
The twenty OTC names that traded the most shares in today's session, regardless of what those shares were worth.
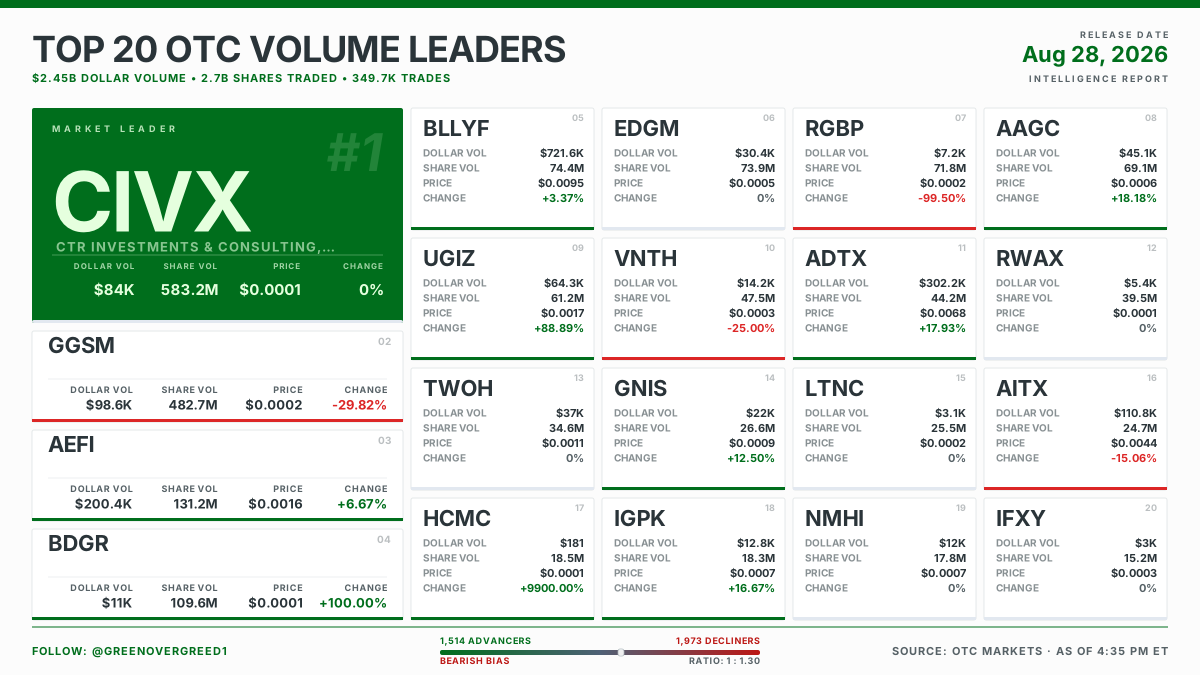
This board and the dollar-volume board cover the same session and rarely agree. The disagreement is the information.
What is in the post
A dated header, the twenty symbols in board order, and one fixed line underneath saying what the board is for. Rank one carries the cashtag.
That fixed line is the whole editorial position of the asset. A name that prints two billion shares and $400,000 is telling you something specific about its price and its float, and the share-volume board is where that shows up.
Where the numbers come from
OTC Markets, the venue's own end-of-session market data, for the session named on the image. Names priced below $0.0001 are excluded.
Reading the image
The layout is identical to the dollar board on purpose, so the two are directly comparable at a glance. Same hero cell for rank one, same four fields in every cell, same colour rule, same market-wide breadth footer.
| Field | What it is |
|---|---|
| DOLLAR VOL | Money that changed hands. On this board it is context, not the sort key. |
| SHARE VOL | Shares traded. This is what the board is sorted by. |
| PRICE | The session close. |
| CHANGE | Percent change on the session. The only field carrying colour. |
How to use the two boards together
Open both for the same session and look for names that appear on one and not the other.
- High share volume, absent from the dollar board. A very low-priced name where a lot of certificates moved and not much money did. Often a sub-penny or trip-zero name where the whole day's trading is a few hundred thousand dollars.
- High dollar volume, absent from the share board. A relatively higher priced name, still under a dime, where fewer shares carried more money.
- Top of both. Genuine, broad participation. This is the rarer and more meaningful case.
The daily OTC Price Bands asset is the same idea applied to the whole market rather than to twenty names.
What it does not mean
- Share volume is not interest, demand, or accumulation. Every share traded had a seller. High volume means high turnover, and turnover is symmetric.
- It is not comparable across prices. Comparing a trip zero's share count to a nine-cent name's share count is comparing two different units. That is exactly what the dollar board exists to correct.
- It is not a gainers list. Ranking is by shares. Direction is the colour on the CHANGE field only.
- It is not a float or a share-structure statement. Volume can exceed the entire outstanding share count in a day, and regularly does. It does not tell you the float turned over.